November 2019: Earth’s Second Warmest November on Record
Inhaltsverzeichnis
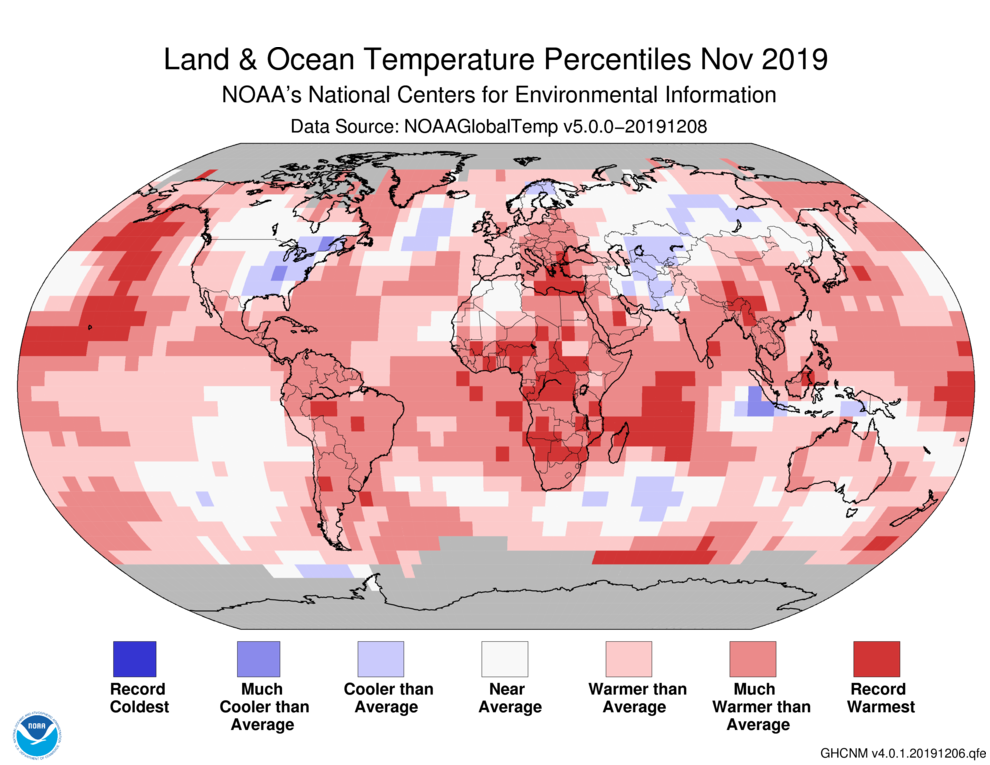
November 2019 was the planet’s second warmest November since record keeping began in 1880, said NOAA’s National Centers for Environmental Information (NCEI) on December 16. NASA also rated November 2019 as the second warmest November on record, a scant 0.04°C behind the record-setting November 2015.
Global ocean temperatures during November 2019 were the second warmest on record, according to NOAA, and global land temperatures were the eighth warmest on record. Global satellite-measured temperatures in November 2019 for the lowest 8 km of the atmosphere were the warmest in the 42-year record, according to the University of Alabama Huntsville (UAH) and RSS.
2019 very likely to be the 2nd warmest year in Earth’s recorded history
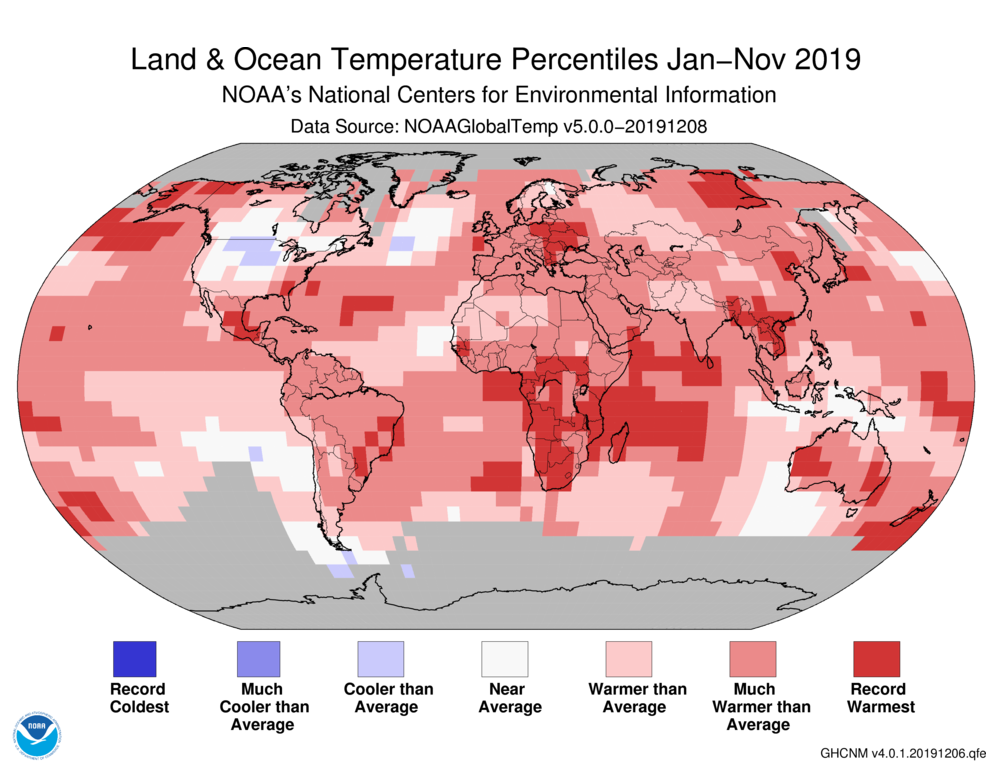
The January through November year-to-date period was the second warmest on record globally, just 0.07°C behind 2016, according to NOAA. Their global annual temperature ranking outlook gave 2019 a 91% chance of being the second warmest year on record, and a 9% chance of being the third warmest year on record. It is virtually certain that 2019 will not be the warmest year on record. Many locations across the globe are likely to see their warmest year on record in 2019, though (see Figure 2).
The remarkable year-to-date warmth means that the six warmest years on record globally since 1880 will be the last six years—2014 through 2019—with the peak occurring during the strong El Niño year of 2016. The near-record global warmth in 2019 is all the more remarkable since it occurred during the minimum of the weakest solar cycle in 100+ years, and during a year when a strong El Niño was not present (though a weak El Niño was present in the first half of 2019, ending in July). Record-warm global temperatures typically occur during strong El Niño events, and when the solar cycle is near its maximum. The near-record warmth of 2019 is thus a testament to how greatly human-caused global warming is impacting the planet.
Two billion-dollar weather disasters in November 2019
Two billion-dollar weather-related disasters hit the Earth last month, according to the November 2019 Catastrophe Report from insurance broker Aon: floods in Austria and Italy (including Venice) that cost $1.9 billion and killed 3, and Cyclone Bulbul in India and Bangladesh, which cost $3.4 billion and killed 39. The deadliest disaster of November was flooding in East Africa that claimed 216 lives and caused over $20 million in damage.
The 2019 tally of billion-dollar weather disasters was 29 as of the end of November. Twelve of these disasters were in the U.S., making it the fifth year in a row for ten or more billion-dollar weather disasters—an unprecedented occurrence. Including 2019, eleven of the thirty years since 1990 have seen 29 or more billion-dollar weather disasters globally (adjusted to 2019 dollars). The record for most billion-dollar weather disasters in one year is 44, set in 2011. Here are this year’s billion-dollar weather disasters as of November 30, as tabulated by Aon:
Typhoon Hagibis, Japan, 10/1 – 10/2, $15 billion, 98 killed
Flooding, India, 6/1 – 10/5, $10 billion, 1750+ killed
Flooding, Central U.S., 5/1 – 7/31, $10 billion, 0 killed
Typhoon Lekima, China, 6/1 – 7/1, $10 billion, 73 killed
Flooding, China, 6/1 – 7/1, $12 billion, 300+ killed
Flooding, Iran, 3/17 – 4/9, $8.3 billion, 77 killed
Cyclone Fani, India, Bangladesh, 5/3 – 5/5, $8.1 billion, 89 killed
Typhoon Faxai, Japan, 9/8 – 9/9, $7 billion, 3 killed
Drought, China, 10/1 – now, $5.75 billion, 0 killed
Hurricane Dorian, 8/31 – 9/7, Bahamas, U.S., and Canada, $5+ billion, 70 killed, 300 missing
Flooding, Central U.S., 3/12 – 4/30, $5 billion, 3 killed
Severe Weather, Rockies, Plains, Midwest, Southeast U.S., 5/26 – 5/31, $4 billion, 3 killed
Cyclone Bulbul, India and Bangladesh, 11/8 – 11/11, $3.4 billion, 39 killed
Flooding, Spain, 9/11 – 9/15, $2.4 billion, 7 killed
Flooding, Argentina, Uruguay, 1/1 – 1/20, $2.3 billion, 5 killed
Tropical Storm Imelda, Texas/Louisiana (U.S.), 9/17 – 9/20, $2 billion, 1 killed
Cyclone Idai, Mozambiqe, Zimbabwe, Malawi, 3/3 – 3/18, $2 billion, 1007+ killed
Flooding, Italy and Austria, 11/11 – 11/19, $1.9 billion, 3 killed
Flooding, Australia, 1/28 – 2/7, $1.9 billion, 3 killed
Drought, India, 1/1 – now, $1.75 billion, 0 killed
Severe Weather, Plains, Southeast U.S., 10/20 – 10/21, $1.65 billion, 4 killed
Severe Weather, Plains, Midwest U.S., 3/23 – 3/25, $1.5 billion, 0 killed
Windstorm Eberhard, Central & Western Europe, 3/10, $1.5 billion, 2 killed
Severe Weather, Central/Eastern U.S., 2/22 – 2/26, $1.4 billion, 4 killed
Severe Weather, Plains, Midwest, Southeast U.S., 5/4 – 5/10, $1.2 billion, 1 killed
Severe Weather, Rockies, Plains, U.S., 7/4 – 7/5, $1.1 billion, 0 killed
Severe Weather, Plains, Midwest, Southeast, Northeast U.S., 4/12 – 4/15, $1.1 billion, 9 killed
Severe Weather, Central Europe, 6/10 – 6/12, $1.1 billion, 0 killed
Severe Weather, Plains, Midwest, Southeast U.S., 3/12 – 3/17, $1 billion, 5 killed
Neutral El Niño conditions reign
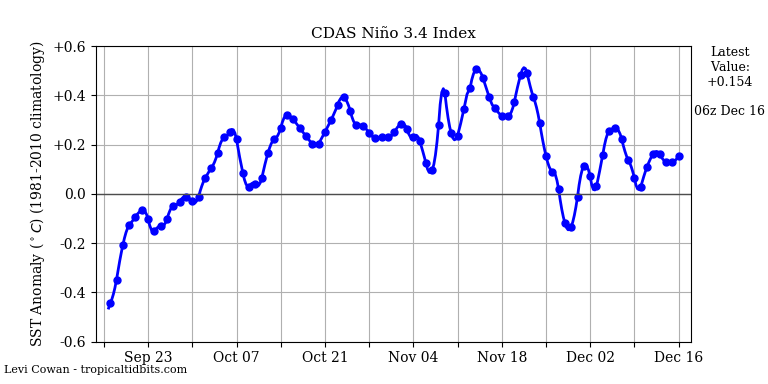
NOAA’s December 12 monthly discussion of the state of the El Niño/Southern Oscillation (ENSO) stated that neutral ENSO conditions existed, with neither an El Niño nor a La Niña event in progress. Over the past month, sea surface temperatures (SSTs) in the benchmark Niño3.4 region of the eastern tropical Pacific, though warmer than average, have been below the 0.5°C above-average threshold need to be considered El Niño conditions.
Forecasters at NOAA and the International Research Institute for Climate and Society (IRI) are calling for a roughly 70% chance of neutral conditions continuing through winter, and a 65% chance of continuing into the spring of 2020. They put the odds of an El Niño forming by spring at about 25 – 30%, and the odds of a La Niña event at less than 10%.
November Arctic sea ice extent: second lowest on record
According to the National Snow and Ice Data Center (NSIDC), Arctic sea ice extent during November was the second lowest in the 41-year satellite record, behind the record set in 2016. By the end of November and through the first week of December, sea ice extent was the third lowest on record, behind 2006 and 2016.
In Antarctica, sea ice extent in November 2019 was also the second lowest for November since satellite records began in 1979. Only 2017 had a lower ice extent.
Notable global heat and cold marks for November 2019
Hottest temperature in the Northern Hemisphere: 43.0°C (109.4°F) at Linguere, Senegal, 5 November
Coldest temperature in the Northern Hemisphere: -53.6°C (-64.5°F) at Verkhoyansk, Russia, 26 November
Hottest temperature in the Southern Hemisphere: 47.5°C (117.5°F) at Vioolsdrif, South Africa, 27 November
Coldest temperature in the Southern Hemisphere: -55.7°C (-68.3°F) at Dome Fuji, Antarctica, 2 and 6 November
(Courtesy of Maximiliano Herrera)
Major weather stations that set (not tied) all-time heat or cold records in November 2019
Among global stations with a period of record of at least 40 years, 2 set new all-time heat records in November. There were no stations that set all-time cold records:
Kowanyama (Australia) max. 41.5°C, 9 November
Point Hicks (Australia) max. 43.4°C, 21 November
Twenty-one all-time national/territorial heat records set or tied in 2019
As of December 15, all-time high temperature records have been tied or broken in 21 of the world’s nations and territories, making 2019 the second most prolific year on record for all-time national heat records. The largest number of all-time national/territorial heat records set or tied in a single year was the 22 heat records that occurred in 2016, according to international records researcher Maximiliano Herrera; 2017 holds third place with 14 heat records. Here are 2019’s national heat records, as of November 15, with notations by Herrera at the end:
Christmas Island (Australia): 31.6°C (88.9°F), 19 January
Reunion Islands (France): 37.0°C (98.6°F), 25 January
Angola: 41.6°C (106.9°F), 22 March
Togo: 43.5°C (110.3°F), 28 March (later tied on 4 April)
Vietnam: 43.4°C, (110.1°F), 20 April
Jamaica: 39.1°C (102.4°F) at Shortwood Teacher’s College, 22 June
France: 46.0°C (114.8°F) at Verargues, 28 June
Andorra: 39.4°C (102.9°F) at Borda Vidal, 28 June
Cuba: 39.1°C (102.4°F) at Veguitas (Cuba), 30 June
Jersey (crown dependency of Britain): 36.0°C (96.8°F) at Jersey Airport, 23 July (record tied)
Belgium: 41.8°C (107.2°F) at Begijnendijk, 25 July
Germany: 41.2°C (108.7°F) at Tonisvorst and Duisburg, 25 July*
Luxembourg: 40.8°C (105.4°F) at Steinsel, 25 July
Netherlands: 40.7°C (105.3°F) at Gilze Rijen, 25 July
United Kingdom: 38.7°C (101.7°F) at Cambridge, 25 July
Norway: 35.6°C (96.1°F) at Laksfors, 27 July (record tied)**
Syria: 50.0°C (122.0°F) at Hasakah, 13 August***
Wake Island (United States Minor Outlying Islands): 36.6°C (97.9°F) at Wake Airfield, 15 August
Guadeloupe (French territory): 36.6°C (97.9°F) at Vieux Habitants, 9 September
Zimbabwe: 45.9°C (114.6°F) at Buffalo Range, 28 October
Comoros: 36.0°C (96.8°F) at Hahaya Airport, 23 November (record tied)
* The official national record of 42.6°C measured the same day at Lingen is irregular and totally incompatible with nearby stations data and with the atmospheric conditions. The station has a history of overexposure and of being unreliable and is set to be moved. Despite this, the record was made official by the German DWD. Estimated overexposure is estimated to be about 2°C.
** This tied record was dismissed by the Norwegian Met. Service on weak grounds despite being reliable and compatible with nearby stations data and the atmospheric conditions. Confoundingly, the totally unreliable and irregular records set in August 1901—30 years before the installment of the first reliable temperature shelter with a Stevenson Screen in Oslo—have not been dismissed.
*** The Hasakah, Syria station has 1°C precision. The max temperature of 50.0°C is supported by nearby stations, so the record can be accepted.
No all-time national cold records have been set thus far in 2019. Most nations do not maintain official databases of extreme temperature records, so the national temperature records reported here are in many cases not official. If you reproduce this list of extremes, please cite Maximiliano Herrera as the primary source of the weather records. Jérôme Reynaud also tracks all-time and monthly national extreme temperature records at geoclimat.org (in French language).
One hundred twenty-one additional monthly national/territorial heat records beaten or tied in 2019 as of December 15
In addition to the 21 all-time any-month heat records listed above, 121 national monthly records have also been beaten or tied in 2019. If we add together these totals, there have been 142 monthly national/territorial heat records beaten or tied in 2019; zero monthly cold records have been set:
January (5): Micronesia, Paraguay, Angola, Equatorial Guinea, Palau
February (19): Chile, Marshall Islands, Guyana, United Kingdom, Denmark, Sweden, Netherlands, Belgium, Luxembourg, Andorra, Austria, Hungary, Jersey, Guernsey, Slovakia, San Marino, Slovenia, Angola, Papua New Guinea
March (5): Australia, Marshall Islands, India, Kenya, Northern Marianas
April (7): Angola, Togo, French Southern Territories, Mayotte, Taiwan, Kenya, Mauritius
May (12): Kenya, Indonesia, Niger, French Southern Territories, Syria, Tonga, Laos, Vietnam, Japan, Israel, Cyprus, Turkey
June (16): India, Tonga, Namibia, Lithuania, Senegal, Qatar, Chile, Laos, Vietnam, Germany, Czech Republic, Poland, Switzerland, Luxembourg, Liechtenstein, St. Barthelemy
July (10): Iran, Wallis and Futuna, Namibia, Jordan, Israel, Hong Kong, Chile, Bonaire, Mauritius, Guadeloupe
August (5): Taiwan, Cape Verde, Namibia, Wallis and Futuna, Kenya
September (13): Oman, Brunei, Niger, Saba, Nicaragua, Paraguay, Brazil, Solomon Islands, Morocco, Comoros, Laos, Jamaica, Kenya
October (16): Hong Kong, Mongolia, Morocco, Micronesia, Qatar, Kuwait, North Korea, China, Saba, Thailand, Mozambique, Botswana, Malawi, Falkland Islands, South Georgia and Sandwich Islands, French Southern Territories
November (11): St Pierre et Miquelon, Haiti, Syria, Tuvalu, Antigua and Barbuda, Reunion Island, South Africa, Namibia, Thailand, Liberia, Singapore
December (2): Indonesia, Iceland
(Courtesy of Maximiliano Herrera)
Hemispheric and continental temperature records in 2019
– Highest minimum temperature ever recorded in the Southern Hemisphere: 35.9°C (96.6°F) at Noona, Australia, 18 January. The record was beaten again on 26 January, with a minimum temperature of 36.6°C (97.9°F) recorded at Borrona Downs, Australia. This is also the highest minimum temperature on record for the globe for the month of January.
-Highest temperature ever recorded in March globally: 48.5°C (91.4°F) at Emu Creek, Australia, on 11 March.
– Highest temperature ever recorded in Asia in March: 46.9°C (116.4°F) at Kapde, India, 25 March. The data comes from a state (not central government) station, and may not be officially recognized, but is supported by data from several nearby stations.
– Highest minimum temperature ever recorded in June in the Southern Hemisphere: 28.9°C (84.0°F) at Funafuti, Tuvalu on 15 June.
– Highest minimum temperature ever recorded in August in the Southern Hemisphere (tie): 28.2°C (82.8°F) at Funafuti, Tuvalu on 15 August.
– Highest temperature ever recorded in October in the Northern Hemisphere: 47.6°C (117.7°F) at Al Wafra, Kuwait on 3 October.
– Highest minimum temperature ever recorded in October: 33.0°C (91.4°F) at Sedom, Israel on 15 October.
– Highest temperature ever recorded in Africa in November: 47.5°C (117.5°F) at Vioolsdrif, South Africa on 27 November (starting from 28 November, the station started giving incorrect temperatures, but the Nov 27th record was fully confirmed by an almost identical temperature at the Noordower station, a few miles from Vioolsdrif).
If you want to read more science articles, you can visit our science category.
if you want to watch movies go to Film.BuradaBiliyorum.Com for Tv Shows Dizi.BuradaBiliyorum.Com, for forums sites go to Forum.BuradaBiliyorum.Com .
